Close Menu

    Subscribe to Updates

    Get the latest creative news from FooBar about art, design and business.

    What's Hot

    Navy SEALs help with search and recovery efforts after Texas floods

    July 13, 2025

    New York City, Las Vegas, Chicago, San Francisco, Los Angeles, Miami: How Tourism Taxes Are Shaping Travel Across the United States, New Update for You

    July 12, 2025

    Charges dropped against doctor accused of dumping $28,000 in COVID vaccine doses

    July 12, 2025
    Facebook X (Twitter) Instagram
    • Demos
    • Buy Now
    Facebook X (Twitter) Instagram YouTube
    14 Trends14 Trends
    Demo
    • Home
    • Features
      • View All On Demos
    • Buy Now
    14 Trends14 Trends
    Home » Data Formulator: Exploring how AI can help analysts create rich data visualizations 
    AI Features

    Data Formulator: Exploring how AI can help analysts create rich data visualizations 

    adminBy adminOctober 6, 2024No Comments4 Mins Read0 Views
    Facebook Twitter Pinterest LinkedIn Telegram Tumblr Email
    Share
    Facebook Twitter LinkedIn Pinterest Email


    white outline icons (representing AI and human computer interaction) on a blue to purple to pink gradient background.

    Transforming raw data into meaningful visuals, such as charts, is key to uncovering hidden trends and valuable insights, but even with advances in AI-powered tools, this process remains complex. Integrating AI into the iterative nature of the data visualization process is particularly challenging, as data analysts often struggle to describe complicated tasks in a single text prompt while lacking the direct control of traditional tools. This highlights the need for smarter, more intuitive solutions that combine AI’s precision with the flexibility of hands-on methods.

    To address this, we’re excited to release Data Formulator as an open-source research project. This update builds on last year’s release by combining user interface (UI) interactions for designing charts with natural language input for refining details. Unlike the previous version, which required users to choose between two methods, this unified approach allows them to iteratively solve complex tasks and with less effort.

    • Download

      Data Formulator 

      Transform data and create rich visualizations iteratively with AI.

    Figure 1: This figure shows the user interface of Data Formulator. There are four callouts in the figure highlighting key components of the user interface. The first call out describes “1. Concept Encoding Shelf: specify charts with field encodings and NL instructions”. The second callout describes “2. (Local) Data Threads: backtrack and revise inputs”. The third describes “3. Data Threads: navigate data derivation history”. The fourth callout contains “4. Data View: inspect original and derived data”. The user interface contains a visualization in the center that shows renewable percentage.
    Figure 1. Data Formulator’s UI

    Creating and refining charts with the Concept Encoding Shelf and data threads

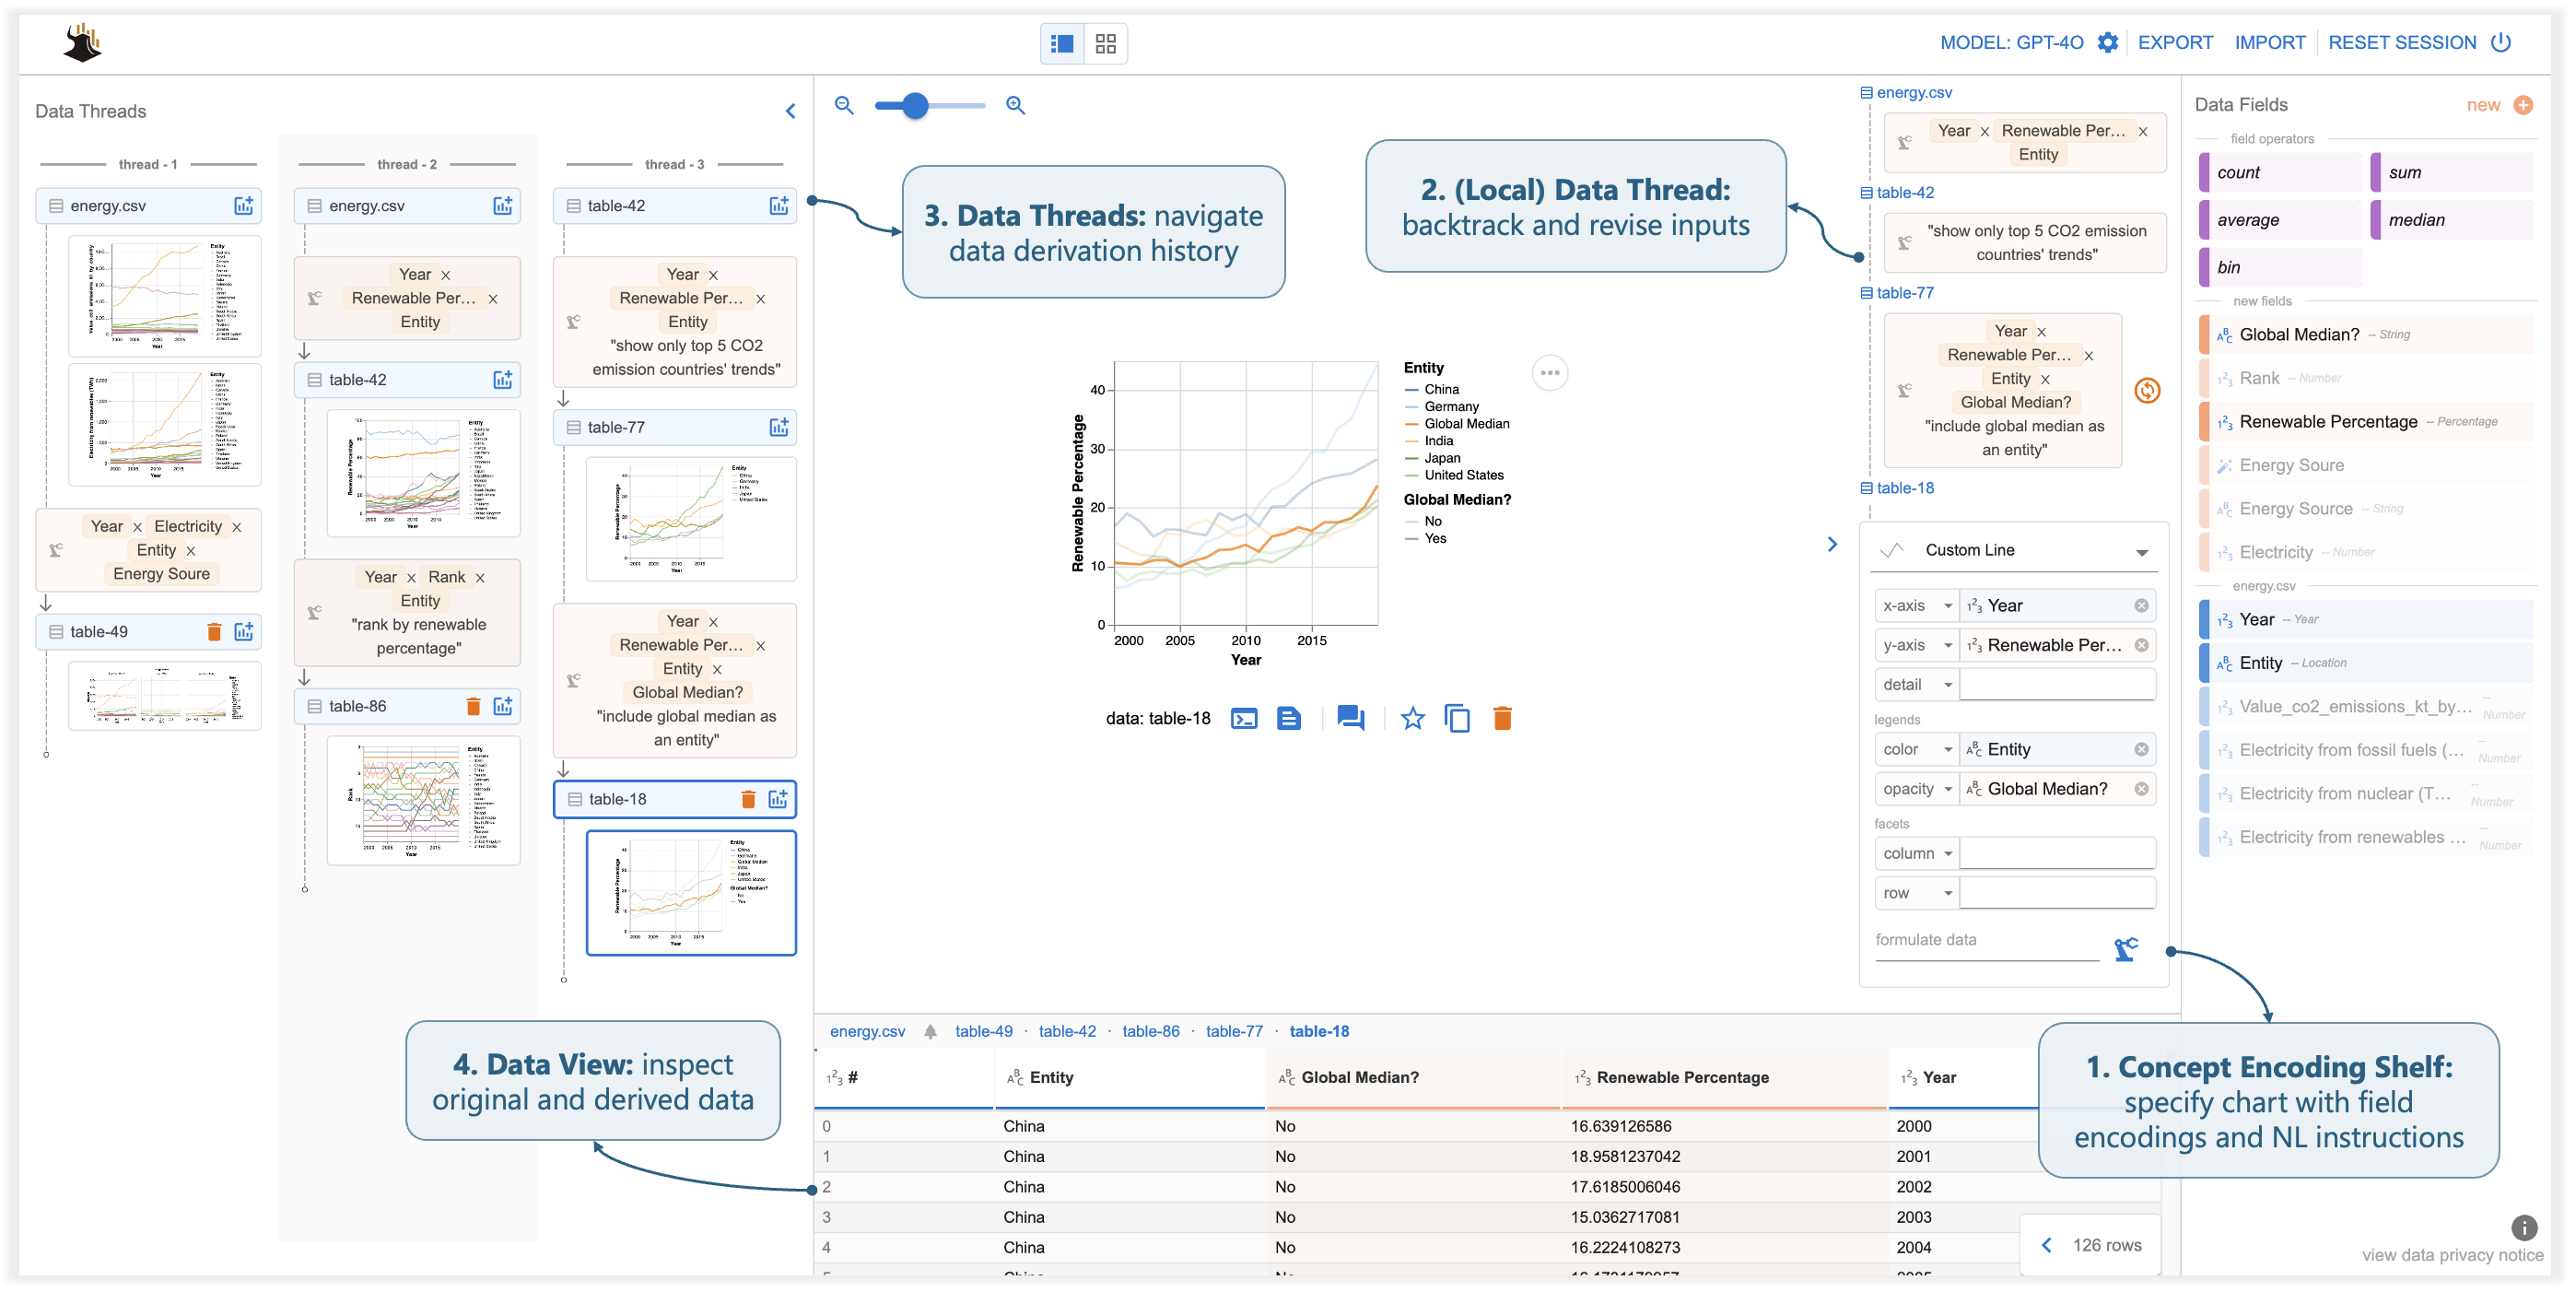
    With Data Formulator, data analysts can now create charts from scratch or select from existing designs through data threads. The UI features a pane called the “Concept Encoding Shelf,” where users can build their chart by dragging various data fields into it and defining them or by creating new ones. A large language model (LLM) on the backend processes this input, generating the necessary code to produce the visual and updating the data threads for future use. This process is illustrated in Figure 2.

    Figure 2: This figure shows the user experience workflow in Data Formulator. On the left it shows Data Threads, and the user clicks a line chart that visualizes the renewable percentage of 20 countries and expands it in the main panel. In the middle it shows “Concept Encoding Shelf”, and the user provides an instruction “Show only top 5 CO2 emission countries”. On the right it shows the result produced from running the user instruction with AI: the result is a table with three columns “Year” “Entity” “Renewable Percentage” and int contains only top 5 CO2 countries’ values; a line chart that only contains these five countries trends is also generated. The line chart is added to data threads.
    Figure 2. To create a new chart, users can select a previously created chart from the data threads and then use a combination of UI elements and language to describe their intent.

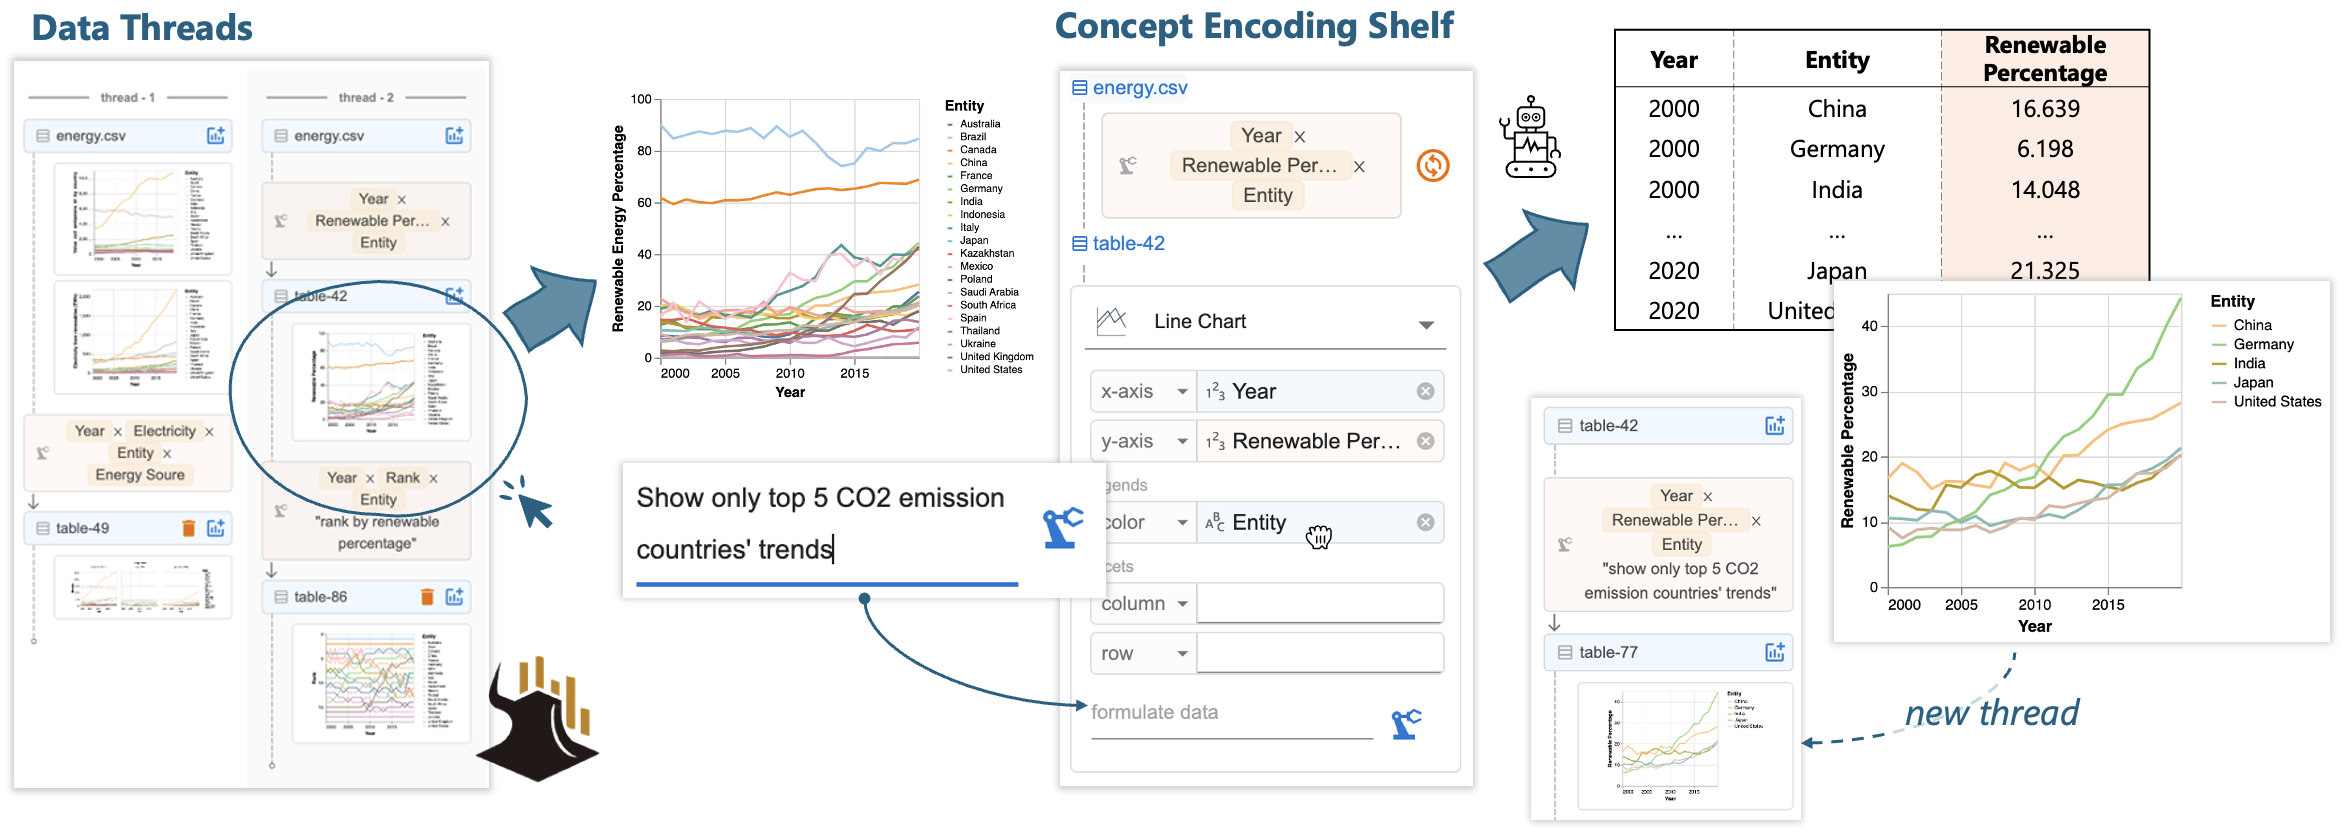
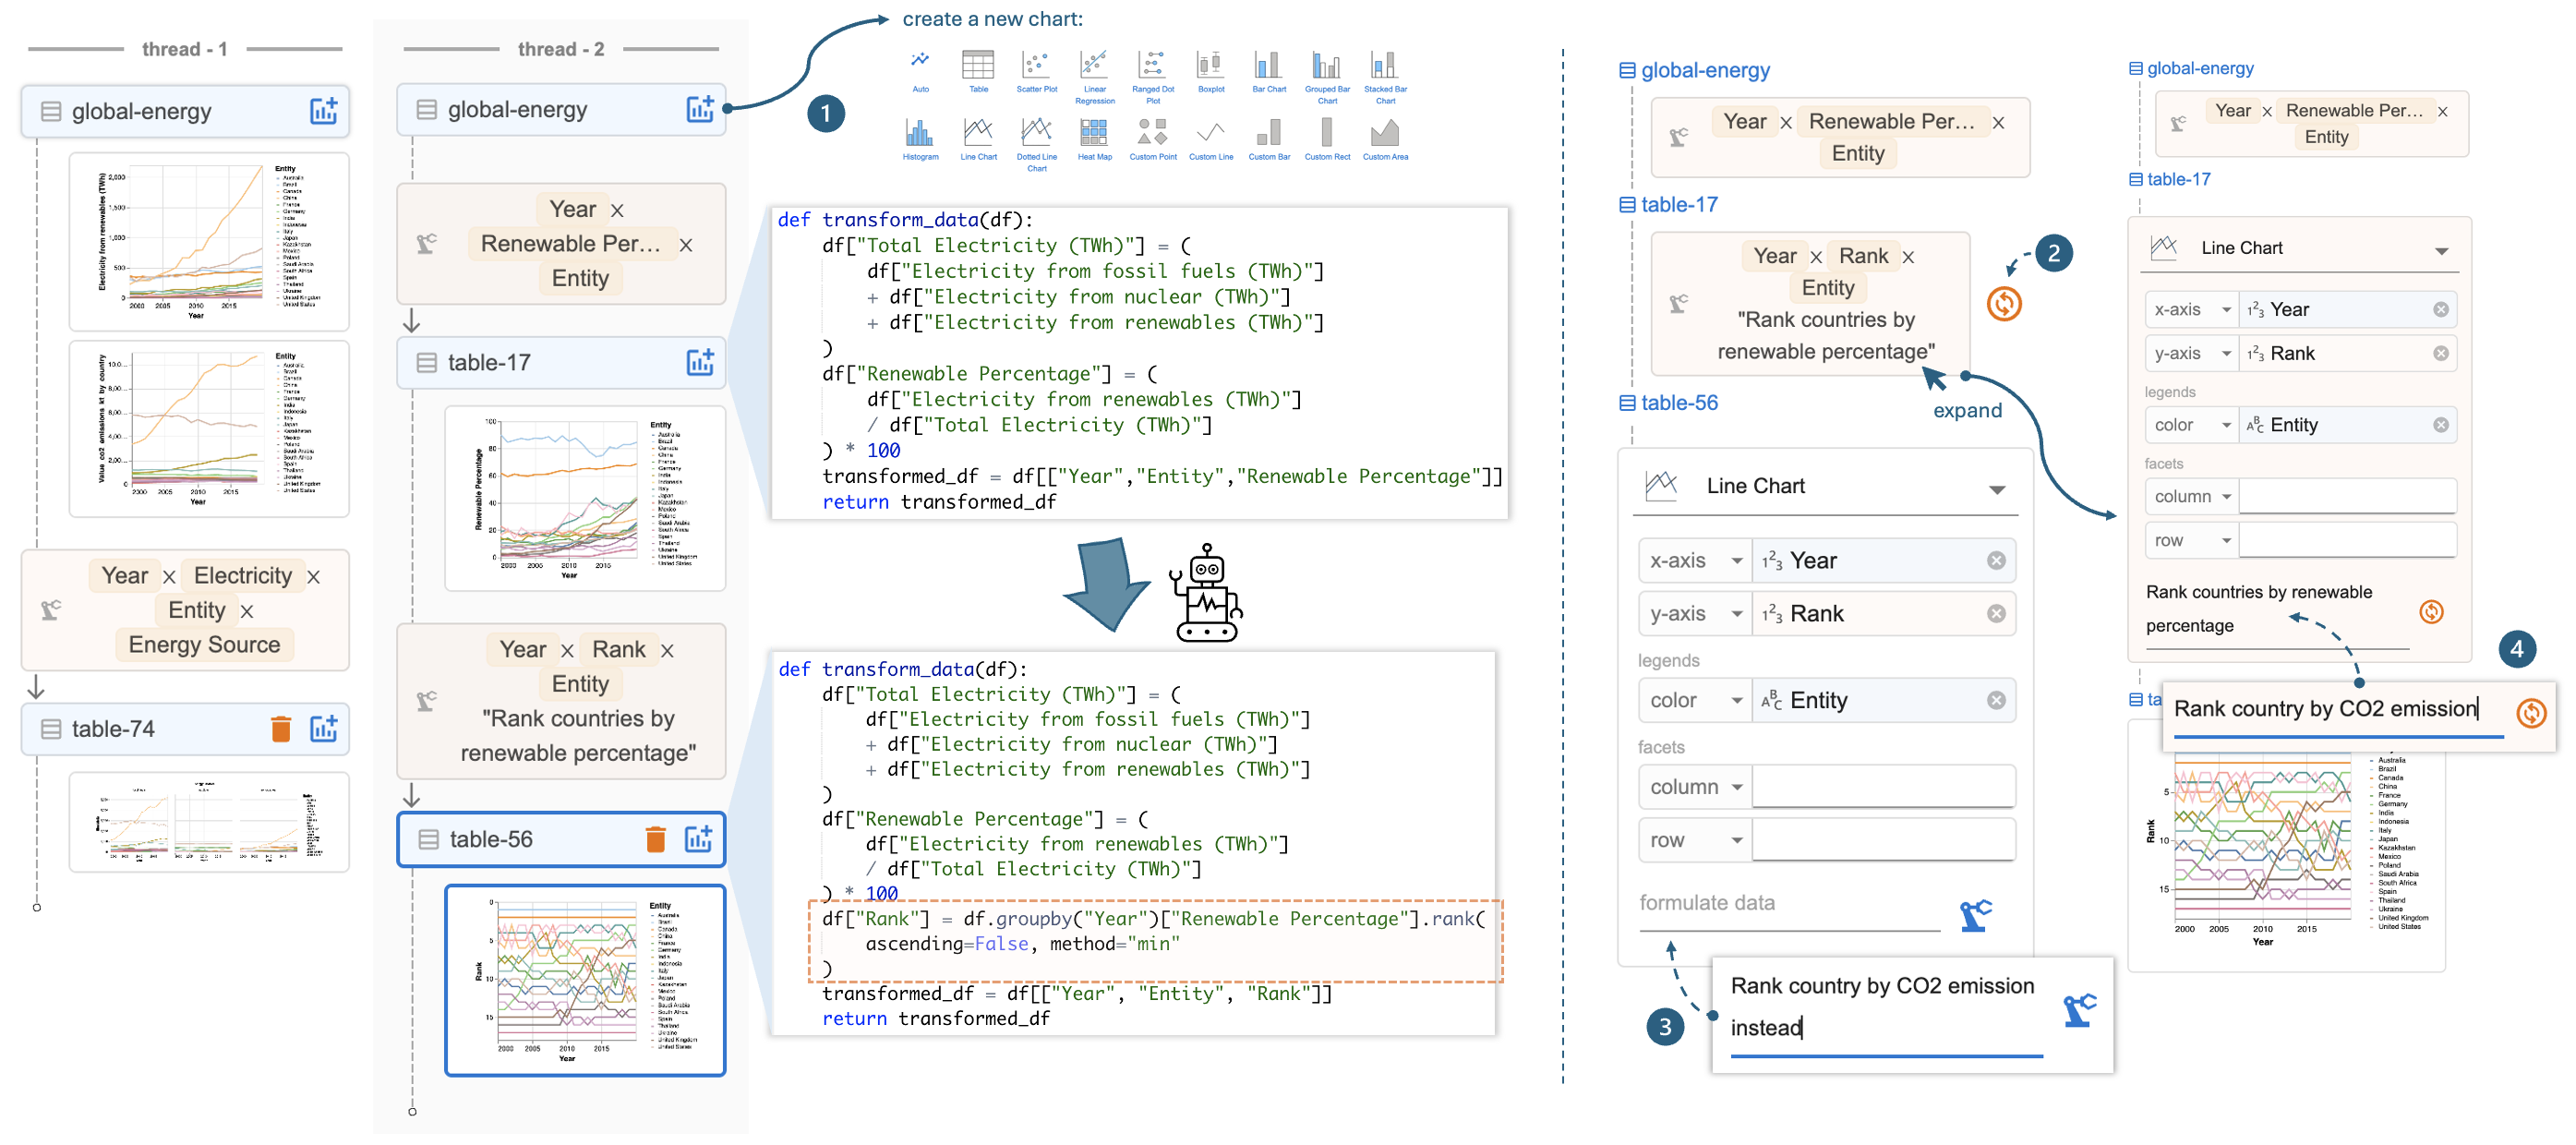
    Data threads enable users to review and modify charts they created previously. This iterative process streamlines the editing and refinement process, as the LLM adapts past code to new contexts. Without this feature, users would need to provide more detailed prompts to recreate designs from scratch. This iterative mechanism also allows users to continue updating their charts until they’re satisfied.

    Figure 3: This figure illustrates how Data Formulator’s data threads work. On the left side, it shows two data threads, one is the derivation process of electricity produced from each energy source from each country from 2000 to 2020, the other is the thread showing that the user derives the renewable percentage of each country per year followed by a line chart that shows the rankings of these countries. The figure illustrates that each of the plots is backed by a python data transformation code to derive data appropriate to the user instruction. On the right it shows actions users can take in local data threads: (a) the user can click and rerun a previous instruction, (b) the user can provide a new instruction to follow up, (c) the user can click the previous card and revise instruction and rerun.
    Figure 3: Data Formulator’s data threads support complex navigation, quick editing, and the rerunning of previous instructions. 

    Data Formulator’s framework

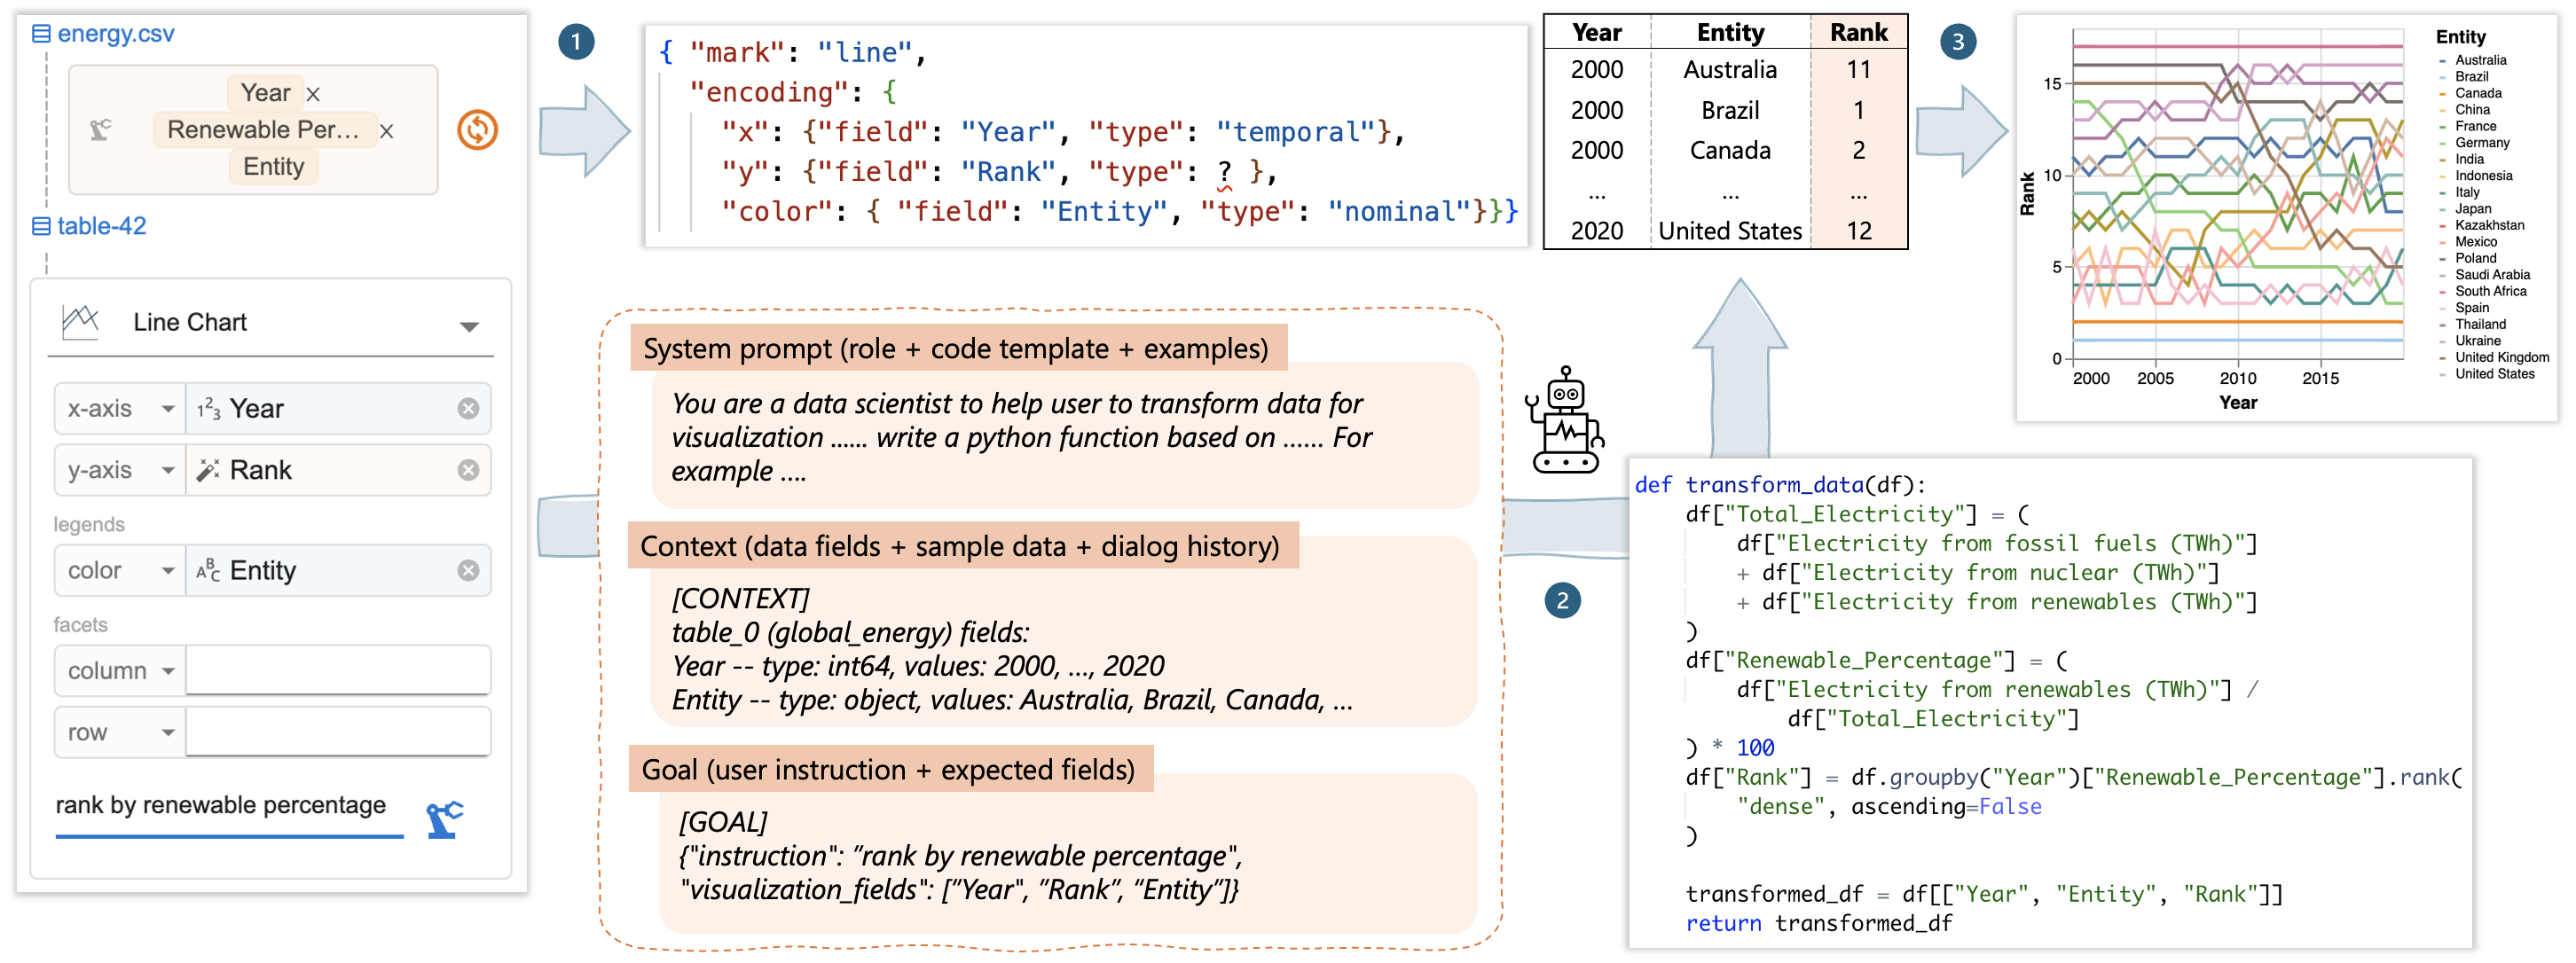
    Data Formulator’s architecture separates data transformation from chart configuration, improving both the user experience and AI performance. Upon receiving user specifications, the system follows a three-step process: (1) it generates a Vega-Lite script, which defines how data is visualized; (2) it instructs the AI to handle data transformation; and (3) it creates the chart using the converted data, as illustrated in Figure 4.

    Figure 4: This figure shows data formulator architecture. The left side shows user’s chart specification with Year on x-axis, rank on y-axis, Entity on color with instruction “rank by renewable percentage”. In the first step, Data Formulator generates a Vega-Lite line chart template with field names. In step 2, Data Formulator compiles a prompt containing “system prompt”, “Context (data fields + sample data + dialog history)” and “Goal (user instruction + expected fields)”, and AI takes this prompt to generate a python code to transform the data. In step 3, Data Formulator combines the data and the Vega-Lite spec to create a line chart that shows ranking of the countries from 2000 to 2020.
    Figure 4: Behind the scenes, Data Formulator compiles a Vega-Lite script from the Concept Encoding Shelf (1), prompts the LLM to generate the necessary code for preparation (2), and, upon creating new data, creates the chart (3).

    Implications and looking forward

    Refining how users interact with AI-powered tools is essential for improving how they communicate their requirements, paving the way for more efficient and effective collaboration. By integrating UI elements and natural language input, we designed Data Formulator to let users to define their visualization needs with precision, leading to better results and reducing the need for multiple clarifications.

    While Data Formulator addresses some challenges in data transformation and visualization authoring, others remain. For example, how can AI assist in cleaning unstructured data without losing critical information? And how can it help users define clear data analysis goals when starting with ambiguous or undefined objectives? We’re actively investigating these research questions and invite you to contribute by building on the Data Formulator codebase (opens in new tab).

    Learn more about our research efforts on human-AI interaction by exploring how we design dynamic UI widgets (opens in new tab) for visualization editing. You can also view a demo of the Data Formulator project on GitHub Codespace (opens in new tab).

    Acknowledgements

    We’d like to thank Bongshin Lee, John Thompson, and Gonzalo Ramos for their feedback and contributions to this project. 

    Opens in a new tab


    Source link

    Share. Facebook Twitter Pinterest LinkedIn Tumblr Email
    admin
    • Website

    Related Posts

    How AI will accelerate biomedical research and discovery

    July 10, 2025

    AI Testing and Evaluation: Learnings from pharmaceuticals and medical devices

    July 7, 2025

    AI Testing and Evaluation: Learnings from pharmaceuticals and medical devices

    July 7, 2025

    AI Testing and Evaluation: Learnings from genome editing

    June 30, 2025

    PadChest-GR: A bilingual grounded radiology reporting benchmark for chest X-rays

    June 26, 2025

    Learning from other domains to advance AI evaluation and testing

    June 23, 2025
    Leave A Reply Cancel Reply

    Demo
    Top Posts

    ChatGPT’s viral Studio Ghibli-style images highlight AI copyright concerns

    March 28, 20254 Views

    Best Cyber Forensics Software in 2025: Top Tools for Windows Forensics and Beyond

    February 28, 20253 Views

    An ex-politician faces at least 20 years in prison in killing of Las Vegas reporter

    October 16, 20243 Views

    Laws, norms, and ethics for AI in health

    May 1, 20252 Views
    Don't Miss

    Navy SEALs help with search and recovery efforts after Texas floods

    July 13, 2025

    Dozens of active duty and former Navy SEALs are assisting search and recovery efforts in…

    New York City, Las Vegas, Chicago, San Francisco, Los Angeles, Miami: How Tourism Taxes Are Shaping Travel Across the United States, New Update for You

    July 12, 2025

    Charges dropped against doctor accused of dumping $28,000 in COVID vaccine doses

    July 12, 2025

    Video Hundreds of cats, dogs rescued amid deadly Texas floods with help from volunteers

    July 12, 2025
    Stay In Touch
    • Facebook
    • Twitter
    • Pinterest
    • Instagram
    • YouTube
    • Vimeo

    Subscribe to Updates

    Get the latest creative news from SmartMag about art & design.

    Demo
    Top Posts

    ChatGPT’s viral Studio Ghibli-style images highlight AI copyright concerns

    March 28, 20254 Views

    Best Cyber Forensics Software in 2025: Top Tools for Windows Forensics and Beyond

    February 28, 20253 Views

    An ex-politician faces at least 20 years in prison in killing of Las Vegas reporter

    October 16, 20243 Views
    Stay In Touch
    • Facebook
    • YouTube
    • TikTok
    • WhatsApp
    • Twitter
    • Instagram
    Latest Reviews
    Demo
    About Us
    About Us

    Your source for the lifestyle news. This demo is crafted specifically to exhibit the use of the theme as a lifestyle site. Visit our main page for more demos.

    We're accepting new partnerships right now.

    Email Us: info@example.com
    Contact: +1-320-0123-451

    Facebook X (Twitter) Pinterest YouTube WhatsApp
    Our Picks

    Navy SEALs help with search and recovery efforts after Texas floods

    July 13, 2025

    New York City, Las Vegas, Chicago, San Francisco, Los Angeles, Miami: How Tourism Taxes Are Shaping Travel Across the United States, New Update for You

    July 12, 2025

    Charges dropped against doctor accused of dumping $28,000 in COVID vaccine doses

    July 12, 2025
    Most Popular

    ChatGPT’s viral Studio Ghibli-style images highlight AI copyright concerns

    March 28, 20254 Views

    Best Cyber Forensics Software in 2025: Top Tools for Windows Forensics and Beyond

    February 28, 20253 Views

    An ex-politician faces at least 20 years in prison in killing of Las Vegas reporter

    October 16, 20243 Views

    Subscribe to Updates

    Get the latest creative news from FooBar about art, design and business.

    14 Trends
    Facebook X (Twitter) Instagram Pinterest YouTube Dribbble
    • Home
    • Buy Now
    © 2025 ThemeSphere. Designed by ThemeSphere.

    Type above and press Enter to search. Press Esc to cancel.